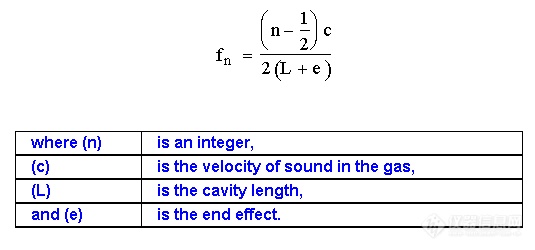
主题:【资料】—几种气相色谱不常用/常用的检测器原理图(英文)

浏览0 回复16 电梯直达
我在故我思
结帖率:
100%
关注:0 |粉丝:0
新手级: 新兵
该帖子已被lianlxh设置为精华;
以下开始介绍几个不常用的gc检测器的原理图,虽然不常用,但是可以了解一下:
(19楼有全部的附件格式的下载,需要的可以下载)
The Thermionic Ionization Detector
Electrons produced by a heated filament can be accelerated by an appropriate potential so that they attain sufficient energy to ionize any gas or vapor molecules in their path. In 1957, the early days of gas chromatography, Ryce and Bryce modified a standard vacuum ionization gauge to examine its possibilities as a gc detector. A diagram of the device is shown in figure 47.

The sensor consisted of a vacuum tube containing a filament, grid and anode, very similar in form to the thermionic triode valve. The tube was operated under reduced pressure and an adjustable leak was arranged to feed a portion of the column eluent into the gauge. The sensor was fitted with its own pumping system and vacuum gauge and the usual necessary cold traps. Helium was used as a carrier gas and the grid collector–electrode was set at +18 V with respect to the cathode and the plate at -20 V to collect any positive ions that are formed. As the ionization potential of helium is 24.5 volts, the electrons would not have sufficient energy to ionize the helium gas. However, most organic compounds have ionization voltages lying between 9.5 and 11.5 V and consequently would be ionized by the 18 V electrons and provide a plate current. The plate current was measured by an impedance converter in much the same way as the FID ionization current. The detection limit was reported to be 5 x 10-11 moles, but unfortunately the actual sensitivity in terms of g/ml is not known and is difficult to estimate. The sensitivity is likely to be fairly high, probably approaching that of the FID. The response of the detector is proportional to the pressure of the gas in the sensor from about 0.02 mm to 1.5 mm of mercury. In this region of pressure it was claimed that the response of the detector was linear . Hinkle et al.  who also examined the performance of the detector, suggested the sensor must be operated under conditions of molecular flow i.e. where the mean freepathofthe molecules is about the same as the electrode separation. Very pure helium was necessary to ensure a low noise and base signal. The detector had a "fast" response but its main disadvantage was the need to operate at very low pressures so that it required a vacuum pump; furthermore, forstability, thesensorpressureneeded to be very precisely controlled.
为您推荐
您可能想找: 气相色谱仪(GC) 询底价
专属顾问快速对接
立即提交
我在故我思
结帖率:
100%
关注:0 |粉丝:0
新手级: 新兵
The Discharge Detector
About the same time that Ryce and Bryce were developing the thermionic ionization detector, Harley and Pretorious and  (independently) Pitkethly and his co-workers were developing the discharge detector. By applying the appropriate potential, a discharge can be maintained between two electrodes situated in a gas providing the pressure is maintained between 0.1–10 mm of mercury. After the discharge has been initiated, the electrode potential can be reduced and the discharge will still continue. Under stable discharge, the electrode potential remains constant and independent of the gas pressure and the electrode current.The electrode potential, however, depends strongly on the composition of the gas. It follows, that the system could function as a gc detector. Pitkethly modified a small domestic neon lamp for this purpose and a diagram of his sensor is shown in figure 48.The lamp was operated at about 3 mm of mercury pressure with a current of 1.5. Under these conditions the potential across the electrodes was 220 V. Pitkethly reported that a concentration of 10-6 g/l gave an electrode voltage change of 0.3 V.

The noise level was reported to be about 10 mV thus at a signal–to–noise level of 2 the minimum detectable concentration would be about 3 x 10-11g/ml. This sensitivity is comparable to that of the FID and the argon ionization detector. The detector was claimed to be moderately linear with a linear dynamic range of three orders of magnitude but values for the response index were not reported. It was not apparent whether the associated electronics contained non linear signal modifying circuitry or not. Unfortunately, there were several disadvantages to this detector. One disadvantage was the erosion of the electrodes due to "spluttering" In addition, the electrodes were contaminated by sample decomposition and it was essential that it was used with a well–controlled vacuum system. 

我在故我思
结帖率:
100%
关注:0 |粉丝:0
新手级: 新兵
The Spark Discharge Detector
Lovelock noted that the voltage at which a spark will occur between two electrodes situated in a gas will depend on the composition of the gas between the electrode tips and suggested that this could form the basis for a gc detector. The system suggested by Lovelock is shown in figure 49.

The sensor consists of a glass tube in which two electrodes are sealed. The electrodes are connected in the circuit depicted in figure 49. The voltage across the electrodes is adjusted to a value that is just less than that required to produce a spark. When a solvent vapor enters the sensor, the sparking voltage is reduced and a spark discharge occurs. This discharges the capacitor until its voltage falls below that which will maintain the spark discharge. The capacitor is then charged up through the charging resistor until the breakdown voltage is again reached and another spark is initiated. Thus the spark frequency will be proportional to (or at least be a monotonic function of) the vapor concentration. The total counts in a peak will be proportional to the peak area and, if a digital–to–analog converter is also employed, the output will be proportional to the concentration in the detector and thus, plotted against time, will provide the normal chromatogram. This detector does not appear to have been developed further but is an interesting example of a sensor that, in effect, produces a digital output.

我在故我思
结帖率:
100%
关注:0 |粉丝:0
新手级: 新兵
The Radio Frequency Discharge Detector
When an RF discharge occurs across two electrodes between which the field is diverging (i.e. within a coaxial electrode orientation) a DC potential appears across the electrodes, the magnitude of which depends on the composition of the gas through which the discharge is passing. Karman and Bowman developed a detector based on this principle. A diagram of their detector is shown in figure 50.

The sensor consisted of a metal cylinder that acted as one electrode with a coaxial wire passing down the center that acted as the other. A 40 MHz radio frequency was applied across the electrodes and the DC potential that developed across them was fed via simple electronic circuit to a potentiometric recorder. The resistance capacity decoupling shown in their circuit appears hardly sufficient to achieve the removal of the AC signal in a satisfactory manner and consequently, the circuit shown in figure 50 may be only schematic. The column was connected directly to the sensor and the eluent passed through the annular channel between the central electrode and the sensor wall.

The response of the radio frequency discharge detector was reported as 106mV for a concentration change of 10-3 g/ml of methyl laureate. The noise level was reported to be 0.05 mV, which would give the minimum detectable concentration for a signal–to–noise ratio of 2 as about 6×10⁻¹⁰ g/ml. This detector had the advantage of operating at atmospheric pressure and so no vacuum system was required. The effect of temperature on the detector performance was not reported, nor was its linearity over a significant concentration range. This detector appears not to have been made commercially
我在故我思
结帖率:
100%
关注:0 |粉丝:0
新手级: 新兵
The Ultrasound Whistle Detector
The velocity of the propagation of sound through a gas depends on its density and, thus, the presence of a solute vapor in a gas changes the velocity of sound through it. This velocity change can be utilized as a basis for vapor detection in 
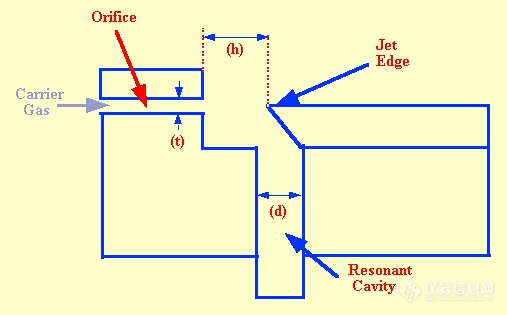
gc. The frequency of a whistle, consisting of an orifice which directs a stream of gas against a jet edge proximate to a resonant cavity, is related to the velocity of sound in the gas passing through it. A diagram of such a whistle is shown in figure 12. Nyborg et al. (38) showed that the frequency (fn) of the whistle could be described by the following equation.

Testerman and McLeod designed and built a detector based on the whistle principle. In their sensor design, typical values taken for the dimensions in the diagram, and variables in the equation, were (t), 0.064 mm, (d), 0.74 mm, (h), 1.676 mm and (L) 3.81 mm.

Under the flow conditions normally used for 
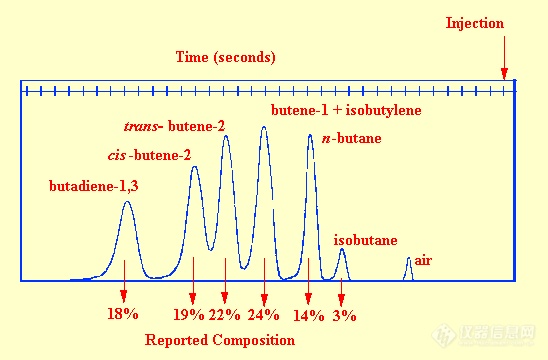
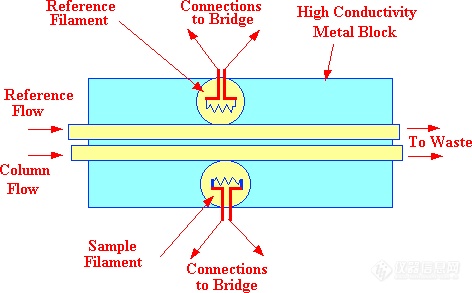
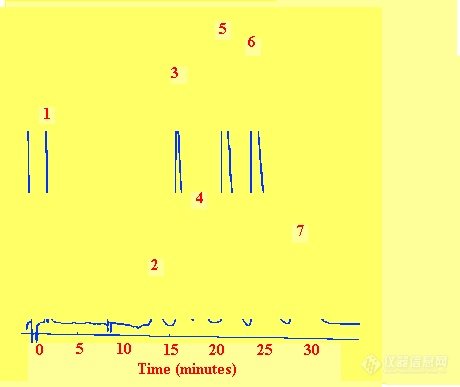
gc separations, frequencies ranging from 30-50 kHz (supersonic frequencies) were observed. The sensor contained two sound generators, one operating with pure carrier gas and the other with the eluent from the column. The two frequencies were allowed to beat together, the beat frequency being directly related to the frequency difference between the two whistles and consequently the density difference between the contents of the two sensors. An example of the use of the whistle detector to monitor the separation of a mixture of hydrocarbons is shown in figure 60. The sample size was 7.5 ml of gas mixture and the carrier gas flow rate was 180 ml /min. This chromatogram illustrates the effective use of the detector and the operating conditions shows its limitations. The sensitivity appears somewhat less than that of the katharometer but the very high flow rates necessary to activate the whistle restrict the use of this type of detector very severely. In the original report the linearity was stated to cover 2 orders of magnitude of concentration but with modern electronics it is likely that this linear range could be extended by at least another order of magnitude.

Figure 60 The Separation of a Mixture of Hydrocarbons Monitored by the Supersonic Whistle Detector
我在故我思
结帖率:
100%
关注:0 |粉丝:0
新手级: 新兵
The Absolute Mass Detector
The absolute mass detector adsorbs the material as it is eluted from the column onto a suitable adsorbent and continually weighs the mass adsorbed.

This system was devised by Bevan and Thorburn [43,44], who adsorbed the eluent from a gc column on to the coated walls of a vessel supported on a recording balance. A diagram of their apparatus is shown in figure 61. The adsorption vessel was 1.4 cm I.D. and about 5 cm high. The walls of the vessel were coated with a high boiling absorbent such as polyethylene glycol or an appropriate normal hydrocarbon depending on the samples being trapped. Under such circumstances the solutes separated had to be relatively low boiling otherwise they would condense in the capillary connecting tube to the adsorption vessel. The tube dipped to the base of the absorber where a baffle was situated to direct the eluent to the walls of the adsorption vessel. The balance record represented an integral chromatogram, the step height giving directly the mass of solute eluted.

Despite the relative casual arrangement of the adsorbent, it would appear that the adsorption was quite efficient and, with 10 mg charges on the column, an accuracy of 1% could be easily achieved. Later Bevan et al [45,46], reduced the size of the absorber and employed charcoal as the adsorbing material. Although this improved the performance of the detector and reduced the necessary sample size, the detecting system was never made commercially. Even after modification, its sensitivity was relatively poor and despite it being an absolute detecting system, it placed too many restrictions on the operation of the chromatograph and the samples that could be chromatographed to be generally useful.

我在故我思
结帖率:
100%
关注:0 |粉丝:0
新手级: 新兵
The Surface Potential Detector
The surface potential detector was developed by Griffiths and Phillips [47,48] in the early 1950s and consisted of a cell containing two parallel metal plates between which flowed the column eluent. One plate was mechanically attached to an oscillator that vibrated the plate at about 10 kHz. If the plates are identical, the surface charge on each plate is the same and so no potential is induced into the second plate by the vibrating plate. If however the surfaces are dissimilar, then the surface charge on each plate will differ and the vibrating plate will induce a potential on the other plate. A diagram of the detector is shown in figure 62.

Both plates were constructed of the same metal but one plate was coated with a monolayer of a suitable substance that would absorb any vapors present in the column eluent. The absorbing layer caused the charge on the two plates to be dissimilar and thus a potential appeared acrossthetwoplates which was balanced out by the bias potentiometer. When a solute vapor passes through the detector, some is distributed into the absorbent layer, changing the surface charge and thus inducing a change in potential between the electrodes. This produces an AC signal voltage that can then amplified, rectified and the output passed to a recorder (or to a data acquisition system). The signals provided by the detector sensor could be as great as several hundred millivolts.

The sensitivity of the detector was claimed to be similar to that of the katharometer (i.e. about 10-6 g/ml). Its response was partly determined by the distribution coefficient of the solute vapor between the carrier gas and the absorbing layer (and thus the chemical characteristic of the coating) as well as the chemical nature of the solute itself. As a consequence, the response varied considerably between different solutes. Within a given homologous series, however, the response increased with the molecular weight of the solute, but this was probably merely a reflection of the increase in the value of the distribution coefficient with molecular weight. Although an interesting alternative method of detection, this detector has been little used in gc and is not commercially available
我在故我思
结帖率:
100%
关注:0 |粉丝:0
新手级: 新兵
以下介绍几种较为常用的检测器:
The Radioactivity Detector
The invention of gas chromatography by James and Martin was evoked by their work on the synthesis of fatty acids in plants. To aid in their research, a method was needed to separate the fatty acids extracted from plant tissue and to quantitatively estimate the different fatty acids present. As a consequence, the technique suggested by Martin and Synge in 1941 (GC) was developed into a practical separation procedure. Subsequently, the synthetic pathways for the different fatty acids were examined using 13C and 3H markers. Thus, having established a technique to separate the fatty acids, those that were radioactive needed to be identified and the relative activity of each peak compared and to do this successfully, a proportional radioactive detector was required. James and Piper described a radioactivity detector 1961-3 suitable for this purpose is still in use today, although the detector has been fabricated in various different forms by a number of different manufacturers. A diagram of the radioactivity detector based on the device of James and Piper is shown in figure 46.

There are two basic forms of the radioactivity detector, one that measures 13C only and the other that measures both 13C and 3H. In both systems the carrier gas used must be helium or argon and the column eluent is fed through a furnace packed with copper oxide to oxidize all the solutes to carbon dioxide and water.

If only 13C is being counted, the combustion products are passed through a drying tube and then mixed with 10% of propane and passed into the counting tube. In the counting tube the radioactive particles cause ionization and the electrons produced are accelerated towards the anode and, in doing so, produce further ionization of the carrier gas which enhances the signal. Normally this would result in a stable discharge being formed but the presence of the propane prevents this happening and for this reason the propane is sometimes called the quench gas. The counting tube consists of a metal cylinder carrying and insulated central electrode in the form of a rod. The outer case is usually grounded and a high potential is applied between the central electrode and the case. The signals received from the counter are integrated with respect to time and thus the output current from the integrator is proportional to the total number of disintegrations occurring per second. As a result, the integration of the signal over the duration of the peak will a give a value that is proportional to the total activity of the peak. The 13C counting apparatus is shown in the upper part of figure 46

Alternatively, if both 13C and 3H are to be counted the apparatus shown in the lower part of figure 46 is used. After the solute is oxidized completely to carbon dioxide and water some hydrogen is fed into the gas stream and the mixture then passed over heated iron powder in another furnace. In this furnace the water is reduced to hydrogen and tritium. In addition, the excess hydrogen saturates any adsorptive sites in the system and reduces the adsorption of the tritium to a satisfactory minimum. 10% of propane is then added to the exit gas from the reducing furnace and passed into the counter which operates in the same way but now counts tritium as well as well as 13C. Unfortunately, the counting efficiency for 3H usually differs from that for 13C, consequently appropriate corrections may need to be made to the final count. The device has been used in many laboratories with considerable success to identify synthetic pathways in biological systems using radioactive tracer techniques.
我在故我思
结帖率:
100%
关注:0 |粉丝:0
新手级: 新兵
The Katharometer Detector
The katharometer was developed in the late 1940s for measuring carbon dioxide in the flue gasses produced from various types of industrial furnaces. A knowledge of the carbon dioxide content allowed the combustion conditions to be changed to improve burning efficiency. With the introduction of gas chromatography, its use as a possible gc detector was explored by Ray . T he sensor is a simple device and is depicted in figure 12.

A filament carrying a current is situated in a tubular cavity through which flows the column eluent. Under equilibrium conditions, the heat generated in the filament is equal to the heat lost and consequently the filament assumes a constant temperature. The heat lost from the filament will depend on both the thermal conductivity of the gas and its specific heat. Both these parameters will change in the presence of a different gas or solute vapor and as a result the temperature of the filament changes, causing a change in potential across the filament. This potential change is amplified and either fed to a suitablerecorder or passed to an appropriate data acquisition system.As the detector filament is in thermal equilibrium with its surroundings and the device actually responds to the heat lost from the filament, the detector is extremely flow and pressure sensitive. Consequently, all katharometer detectors must be carefully thermostatted and must be fitted with reference cells to help compensate for changes in pressure or flow rate.

我在故我思
结帖率:
100%
关注:0 |粉丝:0
新手级: 新兵
The Katharometer Detector

Figure 13. The Off-Line Katharometer Sensor

There are two types of sensor design, the "in-line" sensor where the column eluent actually passes directly over the filament (as shown in figure 12) and the "off-line" cell where the filaments are situated away from the main carrier gas stream and the gases or vapors only reach the sensing element by diffusion.(as shown in figure 13). Due to the high diffusivity of vapors in gases, the diffusion process can be considered as almost instantaneous. The filament wire is usually made from tungsten or platinum as both metals have high temperature coefficients of resistance and at the same time are relatively inert. The column and reference filaments are situated in the arms of a Wheatstone Bridge and a suitable current is passed through the filaments to heat them significantly above ambient temperature. To ensure temperature stability, the sensors and their conduits are installed in a high thermal conductivity metal block which is thermostatted by means of a separate oven. The performance of the in-line sensor is almost identical to that of the off-line sensor.

For maximum sensitivity hydrogen or helium is used as the carrier gas. The katharometer sensitivity is only about 10-6 g/ml (probably the least sensitive of all gc detectors) and has a linear dynamic range of about 500 (the response index being between 0.98 and 1.02).

Figure 14.  The Separation of the Compounds of Hydrogen, Deuterium and Tritium

Despite its sensitivity shortcomings the katharometer can be used in most gc analyses that utilize packed columns and where there is no limitation in sample availability. The device is simple, reliable, rugged and relatively inexpensive. An example of the use of a katharometer to monitor the separation of various compounds of hydrogen, deuterium and tritium, employinggas solid chromatography is shown in figure 14. The stationary phase was activated alumina [treated with Fe(OH)2], and the column was 3 m long and 4 mm I.D. The carrier gas was neon, the flow rate 200 ml/min (at atmospheric pressure) and the column temperature was -196oC.
我在故我思
结帖率:
100%
关注:0 |粉丝:0
新手级: 新兵
The Flame Ionization detector
A detector is considered to be composed of a sensor and associated electronics and it is the sensor unit that is commonly referred to as the FID. A diagram of the FID sensor is shown in figure 16. The body and the cylindrical electrode are usually made of stainless steel and stainless steel fittings connect the detector to the appropriate gas supplies. The jet and the electrodes are insulated from the main body of the sensor with appropriate high temperature insulators. Care must be taken in selecting these insulators as many glasses (with the exception of fused quartz) and some ceramic materials become conducting at high temperatures (200-300oC) .

The use of high voltages in conjunction with the very small ionic currents require that all connections to the jet or electrode must be well insulated and electrically screened. In addition, the screening and insulating materials must be stable at the elevated temperature of the detector oven. In order to accommodate the high temperatures that exist at the jet-tip, the jet is usually constructed of a metal that is not easily oxidized such as stainless steel, platinum or platinum/rhodium.

品牌合作伙伴