主题:准确测定系列3:Sampling and Sub-sampling

浏览0 回复6 电梯直达
tzl75
结帖率:
100%
关注:0 |粉丝:0
新手级: 新兵
该帖子已被4077设置为精华;
3. Sampling and Sub-sampling

Overview 
How often do samples just appear unannounced in your analytical laboratory? There is a general belief that the role of the analyst is to become involved at the sample preparation phase of the measurement process which, in reality, is the third phase, following planning and sampling. This confusion is not an intentional act of neglect, but rather a misunderstanding about the role of the trace analyst.

In addition, the analytical literature is not rich in information or direction. Therefore, the trace analyst has little to go on during the sampling process. The fact is that sampling is critical to the effort in achieving reliable results and forming a sound foundation for the decision making process. The purpose of this chapter is to present the fundamentals of sampling and sub-sampling in a way that will inform and educate.

Much of this information was taken from the references, as well as the titles in the next section. On a personal note, I am truly grateful to the authors of these publications for taking the time and care to produce books containing information so vital to the analytical process.


Sampling Publications   
Taken together, the following books create a solid foundation for the many topics of sampling and sub-sampling:

Sampling and Sample Preparation; Stoeppler, M., Ed.; Springer: 1994.

Crosby, N. T.; Patel, I.; General Principles of Good Sampling Practice; The Royal Society of Chemistry: 1995.

Merks, J.W.; Sampling and Weighing of Bulk Solids; Trans Tech Publications; Federal Republic of Germany; Distributed in North America by Karl Distributors: Rockport, MA, 1985.

James, G. V.; Smith, R.; The Sampling of Bulk Materials; The Royal Society of Chemistry: 1981.
It is beyond the scope of this document to cover specifics on every sample type. The above references contain information vital to the development of sampling procedures for specific sample types, sample populations, and situations.


Developing a Sampling Plan   
In the development of a sampling procedure, the first step is to reexamine the problem definition (see Part 2). The analyst must review how the final results will be used and obtain an understanding of the characteristics of the sample population.

For example, the question "Has this industrial site been contaminated with Pb and Hg?" addresses the immediate concern and prompts the analyst to start thinking about other issues. This thought process would bring about additional questions, such as "Have Pb and Hg compounds been used on this site?" and "What type(s) of compounds were used?"and "Where were these compounds stored?". These questions lead the analyst to an assessment of the scope of the sample population. In some cases, the whole site would be sampled. At other times, the sampling would be limited to specific areas. The analyst can then recommend a sampling procedure using methods already published on soil sampling and tailored to answering the specific question. The analyst may determine that only 3-5 samples are needed in an area where drums that contained Pb and Hg compounds were placed. The other extreme would be to propose a random sampling over a 20 acre site, where 20 samples are pulled in a equally spaced geometric fashion. Other concerns pertain to the 憂ormal' levels of Pb and Hg in the soil for that area where state and local environmental agencies would be contacted for baseline data.

By knowing the objective, the analyst is in a position to recommend sampling procedures that are designed to obtain a reliable answer.

A sampling plan should consider the following:

The objective of the analysis.

The liability/cost of a wrong decision.

The accuracy and precision requirements to obtain data that will allow for a correct decision to be made.

Whether the material has been sampled before.

The degree of homogeneity.

Safety risks, site hazards, and product hazards.

Legal issues, including witnessing or permission grants.

Whether the material is in packages, heaps, bottles, railroad cars -- i.e. - how the material is characterized.

The contamination risks.

The number of samples to be taken.

How the samples will be collected -- by whom and in what kind of container.

The total quantity of the aggregate sample.

Whether specific storage conditions are required.

Whether preservation is required.

Whether and how the aggregate sample will be sampled (sub-sampling).

Whether grinding or sieving will be used.

The size of the final sample and whether more than one aliquot be prepared for analysis.

为您推荐
您可能想找: 气相色谱仪(GC) 询底价
专属顾问快速对接
立即提交
tzl75
结帖率:
100%
关注:0 |粉丝:0
新手级: 新兵
Constructing a Sampling Program   
The above information can then be used to construct a sampling program, using the following set of criteria:

The objective as stated above.

Analyte(s) of interest and method(s) to be used.

Sampling location(s).

Number of samples to be collected and the procedure for sampling, including sample preservation / pretreatment / storage conditions / requirements.

Different Approaches to Sampling   
The following approaches may be specified in the sampling plan:

Random - Random sampling means that any portion of the sample population has the same probability of being taken. Random sampling is often used for production operations that are continuous. It is also used with constraints, such as a the collection of a random sample during the first, middle, and last third of a production lot that must be analyzed separately to determine if the lot is homogeneous.

Systematic - Systematic samples are collected at predetermined intervals that are defined in the sampling plan.

Stratified - Stratified sampling involves specification of depth, size, color, or some characteristic that must be considered in meeting the objective of the analysis.

Sequential - Sequential sampling is often used to determine if a product meets specification. Initially, samples are pulled in a 憇ystematic' fashion and the data is evaluated. If the product is well within specification, no more sampling occurs. If the product is near the specification limit (i.e. - the mean is in specification, but the uncertainty of the measurement goes beyond the specification range), then more samples are pulled to lower the uncertainty and to determine if specification is realized.

Sub-sampling 
This is the process of removing a sample aliquot for preparation and measurement from an individual sample or the aggregate sample submitted for analysis. Obtaining a representative sample is the goal and homogeneity is the primary concern, not only for the original sample collection, but the sub-sampling as well. The smaller the sample aliquot, the greater the risk of achieving sub-sampling errors that will significantly influence the accuracy of the analysis. Sub-sampling may involve an attempt to homogenize the sample by grinding, sieving, blending, or mixing the original sample.

Contamination is of particular concern when the sample is handled, ground, sieved, etc. Therefore, trace analysts should be versed on the contaminants resulting from the use of various ball mills and grinders. The use of Nylon sieves will eliminate contamination risks for all metals and non-metals, except carbon.

Inorganic Ventures does offer an in-depth Contamination Seminar that covers such issues in greater detail
tzl75
结帖率:
100%
关注:0 |粉丝:0
新手级: 新兵
Determination of Sampling and Sub-Sampling Errors 
Relative error is defined as the standard deviation divided by the mean (sd / X). The relationship between the sampling error and the analytical method (preparation and measurement) is shown in the following expression:

Expression 3.1
(sd / X)2total error = (sd / X)2sampling + (sd / X)2analytical
Lets take an example where the total relative error (sd / X)2 total error has been determined to be 0.23 (23% relative) on a solid catalyst sample submitted in pellet-form for total Ni analysis. The question is, "How much of this error is the analytical error and how much is the sampling error?" An estimation of the analytical error can be made from multiple preparations and measurements, made on either a homogenized sub-sample or a Certified Reference Material of the same composition as the sample. For this example, lets assume that a CRM was not available and multiple measurements of sub-samples (taken from a ground sample to pass a 200 mesh nylon sieve) gave a relative error of 0.07. Using expression 3.1 and solving for the relative sampling error (sd / X)2 sampling we get a value of 0.22. Relative sampling errors that are 3 times that of the analytical error are not uncommon.

Also note that effort to lower the analytical error below 1/3 of the sampling error would only improve the total error to a best possible case of 0.22 (22 % relative) -- i.e - doing so would be a waste of time.

A determination of the relative sub-sampling error (sd / X sub-sampling error) would involve the preparation and measurement of four or more sub-samples, where the total relative error is calculated (sd / X total error on sub-sample) and a determination of the average relative measurement precision (sd / X measurement error) is made by calculating the average relative standard deviation of 10 measurements taken on each of the sub-sample measurements. The relationship between the sub-sampling error and the analytical measurement is shown in the following expression:

Expression 3.2
(sd / X)2total error on sub-sample = (sd / X )2sub-sampling error + (sd / X )2measurement error
The above expression is based upon the assumption that neither negative or positive contamination errors are significant during sample preparation or measurement. If contamination is a problem, then it must be lowered to a level of insignificance. Cases where contamination is significant supercede the need for sampling error calculations for obvious reasons.

tzl75
结帖率:
100%
关注:0 |粉丝:0
新手级: 新兵
Contamination Issues During Sampling   

Geological:
Sampling of geological materials can require hundreds of kilograms of material to be processed for the determination of certain elements present in inclusions. For example, Mo and Nb in granite.

Figure 3.1: Generation of Geological Sample

Geological outcrop  sampling  crush and mill to sand size  split to 1/8 the volume  grind to coarse powder  split to 1/8 the volume  grind to fine powder ( 60 microns )
When using tungsten carbide crushing and grinding apparati, the common contaminants are W, Cr, Mn, V ,Co, Fe, Cu, Zr and Zn. Sieves made of nylon are recommended to avoid contamination by all metals.

Soils:
Soil is heterogeneous and the composition varies with depth. Essential and hazardous element distributions down to 50 cm are of interest.

Figure 3.2: Generation of Soil Laboratory Sample

Fresh soil  vegetation and debris is removed and discarded  clean glass jars or plastic bags  stored at 4°C  air-dried in clean place  ground to break down soil aggregates  piled and quartered  ground to fine powder  sieved (60 micron).
Grinding in Alundum ball mills is recommended to avoid contamination from most metals (Al, Si, and Fe are common contaminants from the Alundum). Sieves made of nylon are recommended to avoid contamination by all metals.

Air:
Air particulates are collected by passing a known volume of air through a filter or impactors. The analyst is collecting samples on filters which are a common source of contamination due to impurities inherent in the filter itself. There are no significant concerns for the collection of air samples beyond conventional practice.

Water:
A typical EPA scenario consists of:

Water samples are taken in polyethylene bottles that are pre-washed with detergent, followed by 10% HNO3 and distilled water.

The pH of the sample is adjusted to 2 with HNO3 to minimize adsorption.

Water samples should be stored at 4°C to minimize changes due to biological activity
(e.g. - redox processes).
The analyst should be concerned about contamination from the collection container as well as adsorption and precipitation of the analyte(s) of interest after collection. Of the elements of environmental interest, Hg is the most difficult to keep in solution. Publications of the collection of water samples should be consulted for specific applications.

Biological:
Contamination of biological materials is of considerable concern since the trace metals are typically in the ng/g level. Contamination from the air, sampling devices, and sample storage containers are common. As minimum precautions, a laminar flow clean air bench, plastic sampling devices, and containers that are non-wettable (PTFE preferred) should be employed. In addition the samples are maintained at 4°C during transport and at -18°C for storage.

Some experts maintain that sampling errors have negated most published information on trace-element determinations in biological matrices.1 Thiers stated, "Unless the complete history of any sample is known with certainty, the analyst is well advised not to spend his time in analyzing it."2 Some examples given by Thiers showed a drop in Mn from 2.7 to 0.6 ppb in blood plasma (stainless steel needles contaminate blood with Mn) and a drop in Zn from 1.7 to 0.95 ppb in blood plasma (glass and rubber stoppers contaminate blood with Zn). Other sources of contamination for Al, V, Cr, Mn, Co, Ni, As, Mo, and Cd include plastic tubes, parafilm, wooden applicator sticks, acids, laboratory tissues (Kimwipes and Kleenex), and filter paper.

Contamination Data:
The following Tables show contamination potentials from various elements. The data in Tables 1, 2, and 3 was originally printed in X-Ray Spectrometry.3

tzl75
结帖率:
100%
关注:0 |粉丝:0
新手级: 新兵
Table 3.1: Container Materials
(ppm levels of contaminants)


Table 3.2: Environmental
(elemental composition of contaminants in ppm)


Table 3.3: Contamination of Mineral Acids
(by leaching of container wall during evaporation)

tzl75
结帖率:
100%
关注:0 |粉丝:0
新手级: 新兵
Contamination From Speciation Change:
Trace metals associated with colloids and particles are considered inert4;

The sampling scheme should involve separation of these various forms of metal species in situ or shortly after sampling.


The quality of a representative water sample can be defined as the degree to which the sample retains its composition and properties after the removal from the original environment.


For trace elements, the main factors affecting the quality are contribution of elements due to contamination and loss of species due to sorption and volatilization.
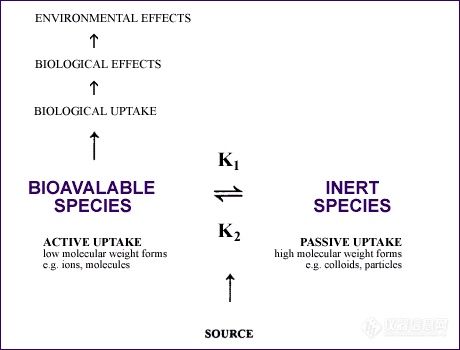
The key point is that contamination can come from the breakdown of "inert" colloids / particles. The following figure illustrates this sample collection contamination issue:

Figure 3.1: The Breakdown of "Inert" Colloids / Particles


The ability to differentiate between phsico-chemical forms is essential for assessing biological uptake of trace elements...

"Following the introduction of non-contaminating techniques for sampling, sample handling, and analysis, as well as developments within analytical techniques and instruments, the concentration levels of trace elements in unpolluted natural waters have been shown to be a factor of 10 to 1000 lower than previously accepted. Thus, the progress made in our understanding of trace element behavior in natural water systems is closely related to improvements within analytical chemistry."4 


1. J. Versieck, L. Vanballenberghe, A. De Kese, D. VanRenterghem, Biological Trace Elemental Research 12 (1987): 45-54.
2. R. E. Thiers, Methods of Biochemical Analysis, ed. D. Glick (New York: Interscience, 1957): 274-309.
3. B. Holynska, "Sampling and Sample Preparation in EDXRS," X-Ray Spectrometry 22 (1993): p. 192.
4. B. Salbu, D. Oughton, Trace Elememental Analysis of Natatural Waters (Boca Raton, FL: CRC 1995): 41-69.


CHNOS-789
结帖率:
100%
关注:0 |粉丝:0
新手级: 新兵
品牌合作伙伴