主题:【原创】连载热电尼高利《Advanced FT-IR Spectroscopy》英文原版

浏览0 回复260 电梯直达
可能感兴趣
diamond
结帖率:
100%
关注:0 |粉丝:0
新手级: 新兵
where G is an overall constant factor due to the different amplification and filtering on the two channels. This experimental spectrum contains Jn(φ0) factors which can be determined by proper VLD calibrations by using a linear polarizer as described in the following section.
diamond
结帖率:
100%
关注:0 |粉丝:0
新手级: 新兵
6.5.3 VLD Calibration and Polarization Modulation-Based Dichroic Difference
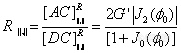
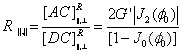
    The VLD calibration measurements are performed by replacing the sample with a reference linear polarizer. The linear polarizer is oriented either parallel or perpendicular to the polarizer positioned in front of the PEM. Thus, the palizer represents a sample that completely transmits one polarization and totally absorbs the other. The respective calibration reference spectra R‖,‖, and R‖,⊥, derived from Equation (6-11) by suppressing T‖ or T⊥, are given by the following relations:


diamond
结帖率:
100%
关注:0 |粉丝:0
新手级: 新兵
where G’ is the same gain factor for the two channels as defined in Equation (6-11) for the calibration measurements. Note that in deriving Equation (612) and (6-13), Mertz phase correction in Fourier transform is assumed, and therefore the reference single beam spectra corresponding to the demodulated AC signals, R‖,‖, and R‖,⊥, should be positive.
diamond
结帖率:
100%
关注:0 |粉丝:0
新手级: 新兵
    By solving J1(φ0) and J2(φ0) from Equations (6-12) and (6-13) and substituting them into Equations (6-11), the dichroic difference spectrum can be expressed as a function of the experimental spectrum S and two calibration reference spectra, R‖,‖, and R‖,⊥:
diamond
结帖率:
100%
关注:0 |粉丝:0
新手级: 新兵
When the gain factor for the two channels are identical for both sample and calibration measurements, i.e. G=G’, Equation (6-14) is further simplified to Equation (6-15):
diamond
结帖率:
100%
关注:0 |粉丝:0
新手级: 新兵
Thus the dichroic difference can be conveniently calculated from both sample and calibration data. However, the calculation of dichroic ratio (A‖ / A⊥) from PM-VLD experimental data remains nontrivial, thus an additional static VLD measurement is suggested.
jhw8064
结帖率:
100%
关注:0 |粉丝:0
新手级: 新兵
diamond
结帖率:
100%
关注:0 |粉丝:0
新手级: 新兵
6.5.4 Application Examples
Polarization modulation vibrational (infrared) linear dichroism has been used to study a variety of polymer films. The sensitivity enhancement gained by using polarization modulation over normal static linear dichroic measurement is very significant, allowing dichroic spectral differences as low as 2×10⁻⁴ absorbance unit to be measured with good SNR. Polymer samples that have been studied by VLD include isotactic polypropylene (iPP), poly(dimethylsiloxane) (PDMS) networks, poly(methyl methacrylate) (PMMA) doped with the azobenzene due DR1, and amorphous azopolymer pDR1A. Figure 6.16 shows a raw PM-VLD spectrum of polyvinyl chloride (PVC) collected by using the Dual-channel PEM module. The spectrum is simply the ratio of AC over DC single beams as suggested by Equation (6-11). A more strict spectral process for VLD is illustrated in Figure 6.17 with a prestretched iPPfilm. The reference spectra R‖,‖, and R‖,⊥ and sample spectrum S shown in Figure 6.17a were the ratios of the dual channel AC over the DC outputs, respectively for the reference linear polarizer in parallel and perpendicular directions, and the prestrectched iPP sample, as defined by Equation (6-12), (6-13), and (6-11).The gain factors of the demodulator were calibrated for all the ratios. Therefore, a normalized PM-VLD spectrum of iPP in absorbance unit was calculated from R‖,‖, R‖,⊥ and S spectra by using Equation (6-15), and it is shown in Figure 6.17b together with a static VLD spectrum of the same sample. We can seen that the PM-based VLD spectrum , as expected, matches the static spectrum very well. The strong VLD effect, as big as 0.4~0.6 absorbance units, was due to the prestretch of the iPP sample. Also it should be noted that in this PM-VLD experiment, a polarization modulation amplitude that maximizes spectral intensity at 1100cm-1 was chosen so that optimum modulation was achieved over the region of interest for the iPP sample.
jlu_tcl
结帖率:
100%
关注:0 |粉丝:0
新手级: 新兵
diamond
结帖率:
100%
关注:0 |粉丝:0
新手级: 新兵
6.6 Polarization Modulation Vibrational Circular Dichroism (PM-VCD)
6.6.1 Introduction
Vibrational circular dichroism (VCD) is the differential absorption between left and right circularly polarized light in the infrared region. It is a measurement of vibrational optical activity for chiral molecules. It is a technique that combines the stereochemical sensitivity of natural optical activity with the rich structural content of vibrational (infrared) spectroscopy. The VCD spectral intensity is generally 4-5 orders weaker than that of regular infrared spectra (10-4 and 10-5 absorption units), therefore, high sensitivity polarization modulation (PM) is required for VCD measurements. The polarization modulation/demodulation approach allows direct measurement of the differential VCD signal with the AC detection and dynamic range advantages over the traditional static method, in which subtraction of the two circular polarizations of light (left and right) is required. Experimental VCD measurements were first reported in the early 1970’s using a PEM based dispersive spectrometer, then followed by an FT-IR-VCD system is focused on in the early 1980’s. The PM FT-IR-VCD system is focused on in this chapter.
猜你喜欢最新推荐热门推荐更多推荐
品牌合作伙伴