主题:【求助】这样的XPS谱图算不算有峰

浏览0 回复10 电梯直达
hankouminjing
结帖率:
100%
关注:0 |粉丝:0
新手级: 新兵
如图所示,合金中含有微量的Cr,约为0.12wt%,利用XPS检测时出现如下的详细谱,请问,这样的谱算不算是这个元素有峰?


为您推荐
您可能想找: X光电子能谱仪(XPS/ESCA) 询底价
专属顾问快速对接
立即提交
可能感兴趣
hankouminjing
结帖率:
100%
关注:0 |粉丝:0
新手级: 新兵
摆度
结帖率:
100%
关注:0 |粉丝:0
新手级: 新兵
Presence of an element ideally require to prove by presence of all peaks in the same family.

So this should be your concept when judging.

Looking at your data, Cr2p should have Cr2p3 and 2p1 peaks. If we were to believe the right peak is 2p3 peak, but 2p1 peak seems really un-obvious. So it looks maybe not presence, and possibly the right peak to be some Auger peaks of other elements?
>>> On this have to judge by full survey knowing what other elements presence in this sample.
hankouminjing
结帖率:
100%
关注:0 |粉丝:0
新手级: 新兵
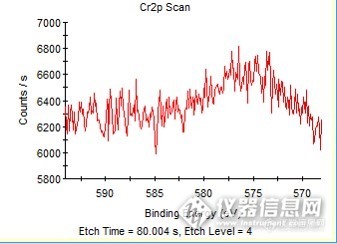
利用Thermo avantage 中的"survey ID automatically identifies elements in the survey spectrum"测得全谱中全谱中只显示O,Zr,Ar,C;样品是含有Sn,Fe,Cr的。俄歇峰似乎也不存在,看来应该是不存在了?

问题二:

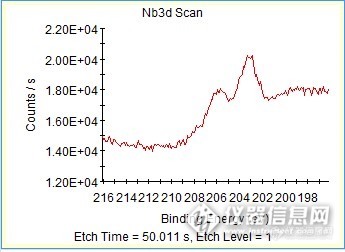
您是否记得我们原先讨论过Nb峰的事,今天我想再请教几个问题。

利用Thermo avantage 中的"survey ID automatically identifies elements in the survey spectrum"测得全谱中无Nb的信息,但是Nb的详细谱中却有明显的峰形,如图所示,不知道这是为何?在本课题组的其他同学的测量含铌(1wt.%)的样品时,同样未检测的Nb,是否与样品基体是Zr, 而作为合金元素的Nb的原子序数与Zr接近,所以二者不能很好的区别,因为在SEM,TEM的能谱中,在检测电压相对较低时Zr,Nb二元素不能区分,不知XPS中也同样存在这样的问题?


问题三:

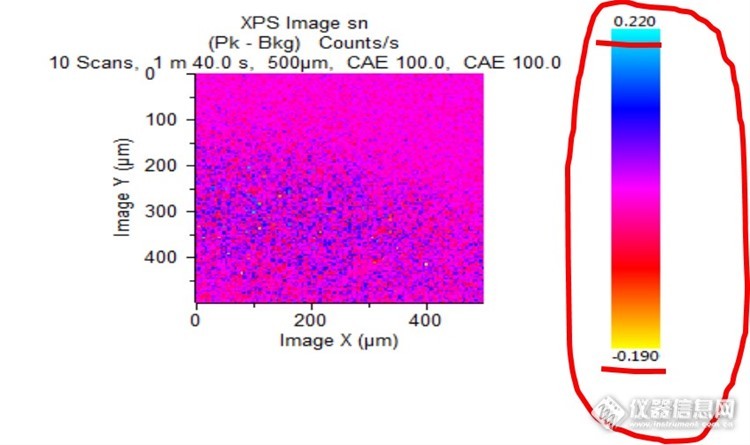
在成像XPS中,不知图片右侧竖杠上下的数字是表示什么?如图所示,是分辨率还是含量或是别的什么,望告知。感谢

摆度
结帖率:
100%
关注:0 |粉丝:0
新手级: 新兵
Q1. Like I mentioned multiple times, judging a presence of a peak require to prove by seeing all the peaks in the same family. So Cr should see Cr2p3, 2p1, 3p, Auger peaks...etc. But sometimes its the fact that the concentration is so low meaning even main peak is so small (e.g. Cr main peak is Cr2p3/2p1). In this case, it becomes every more difficult to see other peaks. But in order to still prove the presence of a peak, sometimes another rule of thumb is to judge the Peak-to-Noise (background) ratio. If you can see a peak to Noise is higher than 5 or even over 10, then you can have good prove to say there is a peak there.

Q2. In XPS, the spectrum is ENERGY spectrum and X-axis is the Binding Energy. And difficulties in XPS analysis is when 2 elements have very closed Binding energies so you cannot separate them. Usually a technique using to separate peak in XPS is called peak fitting. So YES in XPS some peaks when they are so closed it can be difficult to separate them. But it may not mean for elements with similar atomic number than the photo e- energy would come close in Binding energy. Like your case saying Zn and Cr their main XPS peaks are very far away so would not cause problem.

Q3. The color bar is CPS information (count per second). When expressing the XPS data in MAP (image), you are converting the CPS into different color. So that bar tells you the CPS range and color range.
hankouminjing
结帖率:
100%
关注:0 |粉丝:0
新手级: 新兵
Q1: Thank you, i will try like you show me .
Q2:The binding energy of main peak of Zr is 179ev,and the Nb is 202ev, i think the binding energy of these two elements were not very closed, but  from the FIG.of Nb peak i showed, it's confirm that the specimen contain 
Nb, but I don't konw why i can't got the information of the Nb when i used the auto calculate button in the Thermo Avantage software to deal with the result. Can you help me to resolve this problem?
Q3: I get it, thank you very much.
摆度
结帖率:
100%
关注:0 |粉丝:0
新手级: 新兵
Q2. If you believe indeed Nb is presence, just add the peak manually. The Auto-peak-identification is NOT perfect. Its just a software function written by human, and you know human is not PERFECT.

:p
hankouminjing
结帖率:
100%
关注:0 |粉丝:0
新手级: 新兵
成像XPS是不是存在一个几何问题,导致成像出现在固定某个位置出现与别的地方的差异?
摆度
结帖率:
100%
关注:0 |粉丝:0
新手级: 新兵
Imaging XPS is just another way of expressing your XPS "SPECTRUM" data. Remember XPS is just = X-ray Photo-Electron SPECTROSCOPY.

So it is really ALWAYS "SPECTRUM".

The way to get an image XPS (or so call a Map), is that you divided the map into some kind of "pixels" number (e.g. 128x128), and that on each of the 16384 points you will acquire a spectrum. The intensity of that spectrum (AREA of the peak) will then be calculate and shown as "brightness".

Does it answered your question?
hankouminjing
结帖率:
100%
关注:0 |粉丝:0
新手级: 新兵
从您的解释来看,我理解map应该是spectrum的另一种形式,但是我想那么这个map中各个位置处的信息是否就是样品中的位置的情况,能否做到一一对应,还是会在接收信号后在转换的过程中会出现一些设备本身就存在的一种误差。
比如:
1束斑的各位置的能力差异。我不知道这个设备总X光束斑各个位置的能量是否一样,中心区域与周边区域是否一样,因为如果是聚焦束,按理中心区域的能量应该比周边的大些。
2束斑照射在样品的某一区域,各区域的信号接收存在一个接收角的问题,是否这些接收角都一样,并且接收角对谱图以及map的精确度影响如何。

从我上面问题3中提供一张Sn的map,可以看出似乎Sn在左下的地方偏聚了些,同样Fe的map也是这个情况,不知是否是误差造成的?
jamesbons
结帖率:
100%
关注:0 |粉丝:0
新手级: 新兵
猜你喜欢最新推荐热门推荐更多推荐
品牌合作伙伴