由于本人第一次接触这种图 有很多简单的问题不太懂 希望各位高手和老师能帮我看一下 应该怎么解这个图 还有他们的数据
Philips Analytical PC-APD, Diffraction software
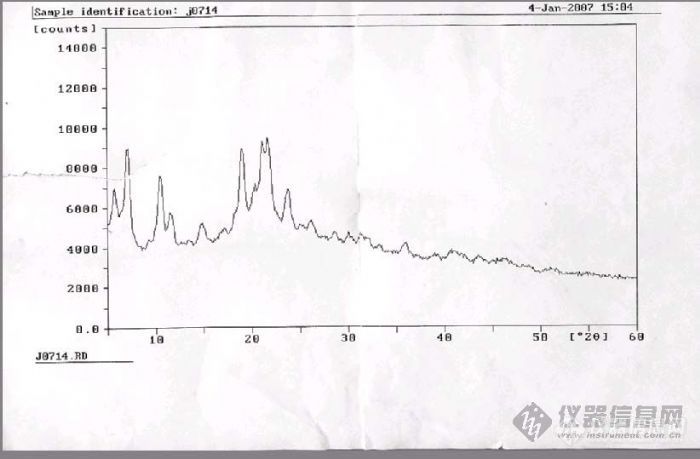
Sampleidentification:j0714 Data measured at: 4-Jan-2007 14:48:00
Diffractometer type: PW1710 BASED
Tube anode: Cu
Generator tension [kV]: 40
Generator current [mA]: 30
Wavelength Alpha1 [Å]: 1.54060
Wavelength Alpha2 [Å]: 1.54439
Intensity ratio (alpha2/alpha1): 0.500
Divergence slit: 1°
Receiving slit: 0.3
Monochromator used: NO
Start angle [°2]: 5.000
End angle [°2]: 61.000
Step size [°2]: 0.100
Maximum intensity: 5227.290
Time per step
: 4.000
Type of scan: STEP
Minimum peak tip width: 0.00
Maximum peak tip width: 1.00
Peak base width: 2.00
Minimum significance: 0.75
Number of peaks: 22
Angle d-value d-value Peak width Peak int Back. int Rel. int Signif.
[°2] a1 [Å] a2 [Å] [°2 ] [counts] [counts] [%]
5.780 15.2781 15.3157 0.400 2830 4173 54.1 3.51 7.156 12.3276 12.3580 0.500 4872 4173 93.2 12.86 10.535 8.3905 8.4112 0.500 3516 4096 67.3 9.52 11.580 7.6356 7.6544 0.400 1529 4147 29.2 2.42 14.730 6.0091 6.0238 0.500 986 4212 18.9 2.87
17.130 5.1722 5.1849 0.300 824 4173 15.8 0.89 18.990 4.6696 4.6811 0.400 4789 4147 91.6 5.70
20.255 4.3807 4.3915 0.300 2959 4122 56.6 0.94 21.055 4.2160 4.2264 0.300 5084 4109 97.3 1.69 21.750 4.0829 4.0929 0.300 5227 4096 100.0 1.93
23.735 3.7457 3.7549 0.500 2841 4083 54.3 5.37
26.035 3.4198 3.4282 0.500 1239 4045 23.7 1.85
28.600 3.1186 3.1263 0.400 745 4007 14.3 1.05 29.945 2.9816 2.9889 0.400 557 3982 10.7 0.81
31.385 2.8480 2.8550 0.400 600 3956 11.5 0.87
32.110 2.7853 2.7921 0.400 433 3944 8.3 0.84 35.985 2.4937 2.4999 0.400 557 3624 10.7 1.00
39.040 2.3053 2.3110 0.600 234 3341 4.5 1.37
40.810 2.2094 2.2148 0.800 520 3226 9.9 1.54
43.545 2.0767 2.0818 0.800 420 3080 8.0 1.49
46.300 1.9549 1.9642 1.000 441 2984 8.4 1.53
48.820 1.8639 1.8685 0.600 240 2760 4.6 0.78
还有图在附件当中 还有整个的数据 希望大家能帮助我 也可以给我发Email yinh398@nenu.edu.cn
![]()
![]() 数据
数据