Time Stability of Arsenic Redox Species
The time stability of As(III) was
monitored in 45 surface and ground water
samples from Yellowstone National Park,
Wyo.; Questa Mine site, N. Mex.,
Summitville Mine site, Colo., Richmond
Mine, Calif., Penn Mine, Calif., Ester Dome,
Alaska, Fallon, Nev., Mojave Desert, Calif.,
and Kamchatka, Russia. Samples were
filtered through a 0.1-μm membrane, acidified
to pH <2 with HCl, and stored in opaque
bottles at 4°C. Samples were reanalyzed as
many as 15 months after the initial
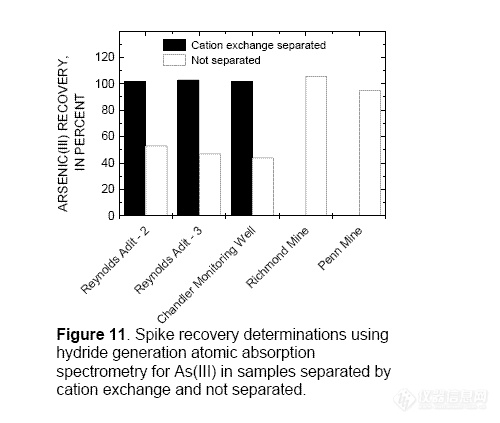
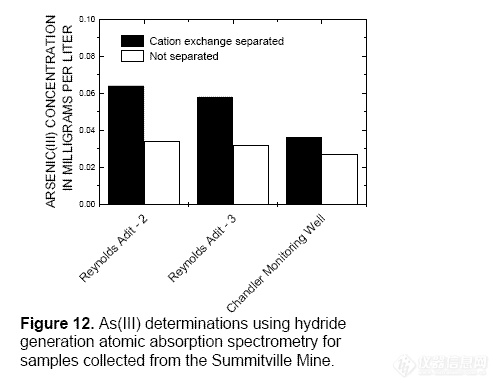
determination. The samples containing Cu(II)
or Fe(III) concentrations that interfered with
the As(III) determination were separated
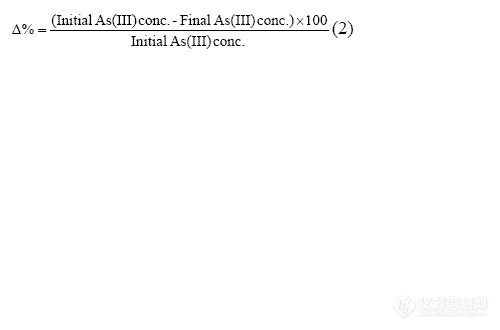
using cation exchange. The change in As(III)
is represented by plotting percent difference
in As(III) concentration as a function of the
initial As(III)/As(T) ratio. The equation used
to calculate percent difference (Δ%) is:
![]()
The As(T) concentration ranged from 0.006 to
33 mg/L and the initial As(III)/As(T) ratio
ranged from 0.01 to 1.0 (fig. 13). The curved
line is a Gaussian Fit. The average percent
difference (Δ%) for all samples was 0.2 with a
standard deviation of 7.