主题:【原创】连载热电尼高利《Advanced FT-IR Spectroscopy》英文原版

浏览0 回复260 电梯直达
可能感兴趣
diamond
结帖率:
100%
关注:0 |粉丝:0
新手级: 新兵
4.2 S2TRS Data Collection and Process
The timing scheme for step-scan TRS data collection are illustrated in Figures 4.1 and 4.2 for master and slave operation modes respectively. Both figures show details of mirror stepping, mirror settling, static sampling, trigger signal and dynamic time-resolved sampling. The sequence of a typical step-scan TRS experiment in master operation mode includes the following steps:
diamond
结帖率:
100%
关注:0 |粉丝:0
新手级: 新兵
1)The moving mirror of the interferometer steps to a predetermined position and then holds stationary to settle down and stabilizer for the amount of time set by Settling Time.
2)The static interferogram is recorded from the DC output of the detector preamlifier. The signal is averaged over the amount of time set by Static Average Time.
3)A synchronized TTL pulse is provided as a trigger signal for the external excitation source such as a laser or a pulse generator that initiates the time-dependent process under study.
4)The AC output from the preamplifier of the detector measures the change in spectral intensity. The dynamic interferograms are collected over a given period of time at intervals set by users. Data are averaged in multiple trigger mode for each mirror step to improve SNR.
5)The moving mirror then travels to the next position and the above steps are repeated.
6)Finally, interferogram data files are reconstructed along the time scale.
diamond
结帖率:
100%
关注:0 |粉丝:0
新手级: 新兵
In the spectrometer slave operation mode, an external perturbation/excitation pulse is used to trigger the TRS digitizer via the spectrometer remote signal accessory, as shown in Figure 4.2. Other time sequences in the TRS slave mode are similar to those of the master operation mode. The relationship between optical retardation, time, and detector signal intensity is illustrated in Figure 4.3.
diamond
结帖率:
100%
关注:0 |粉丝:0
新手级: 新兵
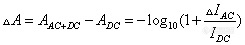
The S2TRS Static Interferogram is similar to the conventional continuous-scan interferogram. Fourier transformation of this interferogram gives the reference single-beam spectrum and the phase array. This phase array is used in the Fourier transform of Dynamic AC Interferograms to produce dynamic single-beam spectra. The absorbance difference spectra can be then obtained by normalizing dynamic spectra over the reference spectrum. The Research OMINC software allows differential absorbance spectra as direct output of a S2TRS experiment if parameters are set properly prior to the experiments. The differential absorbance spectra are calculated based on Equation (4-1):

qxspsys
结帖率:
100%
关注:0 |粉丝:0
新手级: 新兵
diamond
结帖率:
100%
关注:0 |粉丝:0
新手级: 新兵
where IDC and ΔIAC are single-beam intensity spectra corresponding to static (DC) and dynamic (AC) channels. When a different gain is applied to the AC channel, ΔIAC must be calibrated before being used in Equation (4-1). This calibration can be conveniently done by using OMNIC TRS factor setting in the OMNIC3.2.ini file where the TRS factor = gDC/gAC.
diamond
结帖率:
100%
关注:0 |粉丝:0
新手级: 新兵
未来三日晚上有事,提前上传。
4.3 S2TRS Options on Research-Grade Nicolet FT-IR Spectrometers
Research-grade Nicolet FT-IR spectrometers offers TRS measurements on different time scales. As listed in Tables 4.1 and 4.2, a full range of transient digitizers and detectors are available for a Nicolet FT-IR research spectrometer to perform TRS experiments requiring different time resolutions and dynamic ranges.
The standard 100kHz digitizer in the research spectrometers is an inexpensive option for monitoring repeatable process slower than 10μs. The fast digitizers listed on Table 4.1 are installed externally on the workstation and used for more demanding TRS experiments with time resolution up to 2ns. The 14bit 100MHz TRS digitizer is becoming popular with new systems due to its large dynamic range and high speed. The photovoltaic TRS MCT and InSb detectors are used for fast TRS experiments over the mid-IR and near-IR ranges respectively. The Photoconductive TRS MCT is used for relatively slow processed and is often coupled with a standard 100kHz (10μs) internal TRS digitizer.
4.4 Applications of S2TRS
4.4.1 Introduction
The applications of S2TRS have expanded into many fields over the last decade particularly due to the availability of commercial step-scan systems. Active research work using S2TRS has been conducted in fields of photochemistry, material science, biology and biophysics and so forth. These studies have covered a wide range of systems where S2TRS provides a key solution to understanding the kinetic mechanisms. Listed below are a few specific systems that have been studied by S2TRS: 1) kinetic of excited states of metal complexes; 2) photochemical reactions in condensed or gaseous phase; 3) liquid crystals and polymer-dispersed liquid crystals; 4) polymer stretching; 5)protein conformational changes induced photochemically or by temperature-jump; and 6) photocycles of bacteriorhodopsin. A few representative examples are reviewed in this chapter to illustrate various aspects of the TRS technique and the performance of the research-grade Nicolet FT-IR spectreometers.
diamond
结帖率:
100%
关注:0 |粉丝:0
新手级: 新兵
4.4.2 Photochemical Reactions
Photochemical reactions of trans-[CpMo(CO3)]2. The examples chosen here illustrate the utility of step-scan TRS as a technique for both spectral and kinetic studies on nanosecond or longer tome scales. The first example is on the photochemical reactions of trans-cyclopentadienyl molybdenum tricarbonyl, i.e. trans-[ CpMo(CO3)]2 (Cp = cylcopentadienyl) in super critical CO2 fluid at 35℃. The reaction schemes are shown below:
diamond
结帖率:
100%
关注:0 |粉丝:0
新手级: 新兵
The irradiation of the sample solution with a laser pulse (532nm, 10ns pulse width) causes a dissociation of the dimeric tran[CpMo(CO3)]2 into two monomeric radicals, 2 CpMo(CO3), with then undergo recombination to form either the trans- or gauche-isomer. The gauche-isomer is less stable and will isomerize back to the more stable trans-isomer on a slower time scale.
diamond
结帖率:
100%
关注:0 |粉丝:0
新手级: 新兵
A 3D stack plot of TR differential absorbance spectra of this sample over a 40μs time window are shown in Figure 4.4. This set of data was collected with a total data collection time of <2hrs. The time resolution (time interval between two adjacent spectra) is 500ns. These TRS spectra contain both spectral and kinetic information through the course of the reaction. A spectrum at a given time gives the structural information about the chemical species at that time. The kinetic plot of a given band slows the time evolution of the species a associated with that particular band from which the rate constants of the reactions can be calculated. Figure 4.5 shows the time-resolved spectrum at 500ns after the laser pulse and the kinetic plot of the free radical CpMo(CO3). The TR spectra with a time resolution of 500ns capture the early time evolution of the system after laser excitation. The slower isomerization can be measured over a longer time scale of 2ms as shown in Figure 4.6.
猜你喜欢最新推荐热门推荐更多推荐
品牌合作伙伴